Adventures in Programming
a quick tale from the coding mines
the app
I’ve been building an app called SquadMap.app, a graph viz tool built with some interesting javascript libraries (namely cytoscape, svelte, and firebase) to help people map out their safe quarantine squads during the coming pandemic this winter. Go check it out if you haven’t yet - you’ll see that a big part of the experience is watching how the colors on the graph nodes, which signify the risk exposure to the person or people at that node, change as you change the connections and properties in the graph.
the problem
I’m going to try to keep this story more or less readable to the non-coder because this blog isn’t specifically about engineering, but I won’t skip the math and graph theory involved. Fact is I’m not great at math anyway.
I was showing off the app to a friend, who was suitably impressed, but then immediately pointed out something that to her, intuitively, seemed wrong.

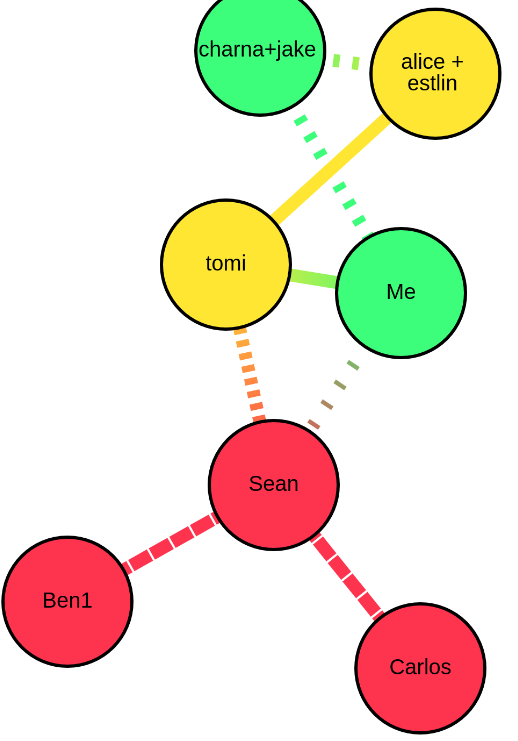
Take a look at this picture. The node labelled alice+estlin is yellow, signifying risk. They have an undistanced (ie, hanging out indoors) connection with the node labelled tomi, who is also yellow, and gets that risk exposure from the partial connection to Sean. All well and good. But why, then, is the node labelled Me, with the same exact connection to tomi, and same properties as alice+estlin, not yellow as well? The green signifies low risk, meaning my graph tool’s risk exposure algorithm had determined that the Me node was at less risk than the alice+estlin node - but unfortunately I was able to verify that this was in fact wrong. Did I have a bug?
the call
As I started digging into this yesterday (7-25-20) morning, I texted my dad, who works in epidemiology. I thought he might have some good advice on how to fix the algorithm. He’s not a mathematician either but he knows people. At that time I had just started down the road on my first attempt at a solution and I was feeling optimistic. I’d already fixed some UX stuff in the navbar in the app, so it was shaping up to be a productive, happy day. We spoke for some 20 minutes, and he pointed me towards a library written in R (EpiModel) that could probably do what I wanted.
Unfortunately I would have had to get R running to access that code, as far as I could tell, and I worked with R a decade ago and don’t really like it. But at that point I was already feeling good with my first stab at a fix, so I told my dad, “you know what, I think I’ve got this!” and we said bye. Hoo boy was I wrong - I can look back at this as the last moment when things were still “going alright”.
the design flaw
So what was causing this discrepancy in the risk exposure algorithm? To answer that I’m going to have to get into the weeds here. If you want to skip this section, the story of how I almost lost my mind continues below.
OK. The algorithm has to calculate the risk at each node, and to do that it has to look at each node’s connections to every other node, and the risk at each of those nodes as well. It goes over each one and sort of “rolls up” the risk from that node to the next, until it arrives back at the node in question.

Consider this simple setup. joey is high risk, me is low, and steve is also low. but joey is fairly exposed to me, and so the me node turns almost red. me and steve are keeping more distance, and so steve stays green. The way the algorithm rollup works to figure out that steve is still green is like this:
- Start at joey
- compute joey’s risk based on the properties we’ve given him (in this case, like I said, fairly high due to his employment and behavioral patterns)
- multiple that by the scaling factor determined by the exposure between nodes joey and me (in this case fairly close to 1 because of the amount of exposure - so this is basically modelling the fact that joey and me are not effectively social distancing.)
- now add that internal value (risk times exposure scaling) to the same calculation for computing the risk between me and steve - this is the rollup. You just continue to compute node times scaling factor at each node+edge, and roll up towards the node in question. The final sum of values is your risk probability at the node in question.
- As you roll up from each node to the target, if you’ve already rolled up that node’s value while on the path from another node, skip it this time.
- (Then you do the whole algorithm for every other node too, to get everyone’s exposure risk probabilities.)
It’s not, by itself, in any way, a complicated algorithm. Which is good, because like I said I’m not great at math and graph theory. But there’s a hard part we didn’t even touch yet - how do you know what path to follow while you’re rolling up nodes? In the toy example above it doesn’t matter because it’s just 3 nodes in a straight line. But what if it looks more like this?

That’s the graph from the beginning of this post. How do you decide which nodes to look at while rolling up the risk from Carlos to alice + estlin?
When I wrote the rollup algorithm, I used another algorithm to decide this pathing, one that’s very famous in graph theory - it’s called “Dijkstra’s Algorithm”. It computes the shortest path between two nodes in a graph, and it’s relatively efficient at doing so, so that’s what I decided to use. One constraint I have in this app is that everything has to happen in real-time, and it has to work on phones. If the algorithm is chunky and slow, the whole app will fall apart.
So what was really going wrong?
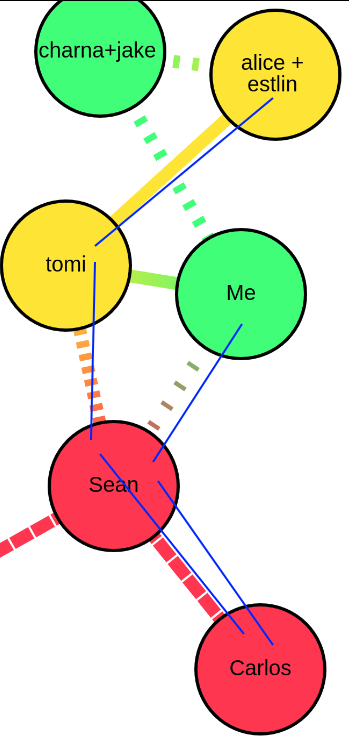
Now I can finally explain the issue. Check out the shortest path from Carlos to Me - it goes:
- Carlos
- Sean
- Me
And check out the shortest path from Carlos to alice+estlin - it goes:
- Carlos
- Sean
- tomi
- alice+estlin
So even though me and alice+estlin are both connected to tomi, if we only roll up the shortest path, the me node does not compute the rolled up exposure from sean, through tomi.
It only computes from sean to me.

But the edge from sean -> me is distanced, while the edge from tomi -> me is not.
The algorithm will also roll up, separately, from tomi to me, but the node at tomi is not a risk on its own - its only a risk in the context of sean.
And that won’t get caught in either rollup path for me.
So this issue wasn’t a bug! Everything I’d designed was working as expected, it’s just that the design itself didn’t take into account a situation where the graph had multiple paths between people, such that some paths were dangerous but farther away. I’d call this a huge design flaw. And in fact it came up the very first time I tried to use the app with actual real-world data.
My first attempt
So I thought to myself, “how can I fix this quickly?” I figured the issue was that the algorithm is rolling up from tomi to me, but it’s not taking into account the actual risk at tomi. So what if I added a second pass in the algorithm - first do the same rollup algorithm as before, but then do it a second time, and use the rolled up values from the first pass as the starting values for the second pass. This way, when the rollup computed tomi->me, it would see tomi’s true risk value and not just her intrinsic risk.
This was the attempt that I’d been working on right before my call with my dad, when I told him I thought I’d got it. And it does sort of do what I wrote above - but the issue is that it has no way of knowing if a node has a longer or shorter, riskier or less risky rollup path, so even if it does bring more risk from tomi to me, it also brings even more risk to alice+estlin - so it only exacerbates, or at the very least doesn’t mitigate, the actual problem at hand.
Put another way, the graph would have the same intuitively unfair risk exposure results. So I had to go back to the drawing board.
the disaster
I was thinking about what I really wanted this algorithm to do, and I realized that only rolling up the shortest path is not all that helpful. All the paths between nodes convey exposure risk, so I should really be running my rollup calculations on all the paths. If we get a list of every path between each 2 nodes, and run the rollup on all of those paths, but also like before we skip edges that we’ve already computed, we should be able to get a more comprehensive assessment of the risk to the node. It would solve my design flaw, because not only would I be computing the risk of the short path from Carlos to me through sean, but simultaneously the risk of the longer path through tomi and then to me.
I spent a long time looking for pre-written algorithms to solve this problem of finding every path between two nodes, and I found plenty of examples, but none were written with my exact context in mind. None used javascript, or they didn’t work well with Cytoscape.js, the graphing library I’m using, or they didn’t take certain things into account, or they had other constraints.
From a graph theory perspective, you can’t even really do what I wanted without a bunch of constraints, since there are potentially infinite paths between any two nodes (if you can go in a circle).
And remember, I have this huge constraint where the algorithm has to be able to run in the blink of an eye on a phone.
This is where we entered the disaster zone. Literally, that’s what I named the branch on github when I finally pushed this attempt up to store for posterity. I’m not going to use this code; but I can’t throw it away. I spent 7 hours on it. I wrote the path-finding algorithm by hand to fit my needs - it recursively traveled all over the graph, building up paths that I could then pass back into the rollup algorithm.
You know what? Not only was it crappy and buggy and barely even doing what I needed, it was extremely slow. All I had to show for 7 hours of work was something that I knew, in my heart of hearts, would never suffice for my purposes. When I finally realized this and gave up, I was pretty crestfallen. I really wanted to be done with this issue so I could enjoy my day, but I felt terrible not having a solution.
the soul seeking
I like to say that I’m a pretty experienced engineer by now. One of the main things, I think, that makes you an expert, is that you know when to fold. This either manifests when I tell a designer or product manager that their idea is unworkable early, before we ever start trying to build, or it manifests when I start to smell something wrong with a solution I’m building, and I “back out” out of that path early to go down another one. My point is that expert engineers know when to fold early. But in this case I just… didn’t. For me early is 10 minutes, maybe 20. I can’t remember the last time I spent 7 hours on a failing, hopeless solution. I guess I was sort of having fun but by the end I was also totally wiped. (On a Saturday! When I thought I’d be relaxing and reading after spending an hour fixing this!)
So, lots of lessons learned. I’m not great at graph theory. I am still capable of big engineering mistakes. The code is here if you’re curious - all the green is brand new lines of code. In my profession, altho writing brand new lines of code is our job, we actually measure our success by how little we write - because every new line is a new liability, something that can break, something that you have to debug and maintain. Clearly by that standard, even if this solution had worked, I’d have added a lot of overhead to the project.
the other solution
After a little rest to clear my head, I considered abandoning the problem until the next day, but I couldn’t stop thinking about it. When that happens I usually just go with my instinct. So I decided to return to my earlier 2-pass solution.
Well the short of it is that didn’t work either. I only spent another 40 minutes on that, playing with counting the times the rollup algorithm visited each node and then scaling the risk probability down for nodes that got visited more often. It only sort of worked. The fact is, I don’t want the algorithm to only sort of work.
the miracle
This story has a happy ending! I can’t even explain it. I was listlessly, hopelessly scrolling around cytoscape graphing tool documentation when something caught my eye that I hadn’t previously noticed. The Djikstra algorithm, the very same one I’d started off with, had a parameter in the documentation for a weighting function. And I instantly, intuitvely knew that this was going to work. Like a lightning bolt. It said:
weight: function(edge) [optional] A function that returns the positive numeric weight for the edge. The weight indicates the cost of going from one node to another node.
Basically it was saying, if I call this function with another function I pass in, I can tell it how to decide which path to follow, sort of. I get a little more control compared to just “shortest” - in fact, I can say “shortest according to my weightings at each edge”. And I already had a built in weighting system at each edge, the exposure scaling factor (which if you’ll recall models peoples’ attempts at actually distancing from each other).
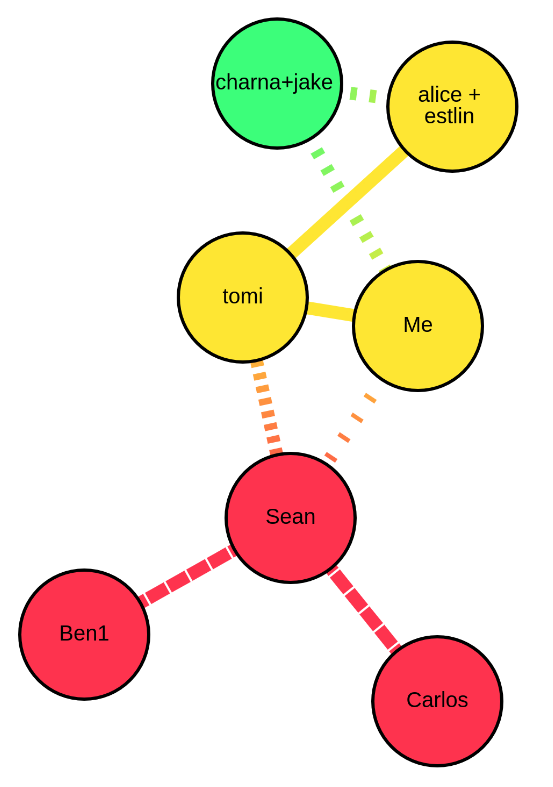
It quickly occurred to me that if I told djikstra to follow the weighted path where the less socially distanced two nodes are, the stronger the weight is, I’d end up with a path that would be a lot more “fair” - I’d basically always choose the path of “most infectiousness”. So in the original example, the weighted path from Carlos to Me would now be:
- Carlos
- Sean
- Tomi
- Me
And the weighted path from Carlos to alice+estlin would be:
- Carlos
- Sean
- tomi
- alice+estlin
Which is exactly what we wanted.

This solution doesn’t look at every single path, so it still definitely misses some information. But it will get the most infectious path, which means it’ll get the most important information for our use case. And it runs just as fast as before, and it took only a few lines of code to implement! Compare that to the other “solution”! This was what I had to show for myself. My miracle took a couple minutes to write and test out, but 8 hours to arrive at.
Anyway thanks for sticking with the story. I had to write it up so I wouldn’t forget this lesson, which is, I guess, that I’m too old to hand write my own pathing algorithms, and I should just keep researching until I find good easy solutions. Or maybe, put another way - “The elegant solution is out there, and if you think you have to reinvent things, you’re probably wrong.” Or something.